Performance overview of AD/ADAS
“Find needles in a haystack” for the development & validation of AD/ADAS

You want to find specific relevant driving events and near-misses over millions of hours of driving data to make sure your required functionality behaves correctly. The best way of doing that is creating an overview analysis of your system performance that will allow you to find specific points in your datalog.
The importance of an AD/ADAS overview
To develop, evolve, test and validate Automated Driving (AD) functionalities, or Automated Driving Assistance Systems (ADAS), companies are generating thousands of hours of data logs containing driving data, both in simulation and real-world drives. How do you know if your system is always behaving as required? Are the developments heading towards a better performance?
A common approach is to analyze “disengagements” of the AD/ADAS system, which helps in understanding “why” the system failed. Then we could group these underperformances, providing an overview to prioritize the corrections of these failures.
But disengagement analysis only covers “known” annotated misbehaviors. What about the edge/corner cases? More importantly, what about near-misses, referring to something that occurred which could lead to a catastrophic event but luckily did not? An example could be as seen in the Figure below. The ego vehicle believed it was running into a collision trajectory against vehicle 1, a false positive detected vehicle or “ghost detection”. Because of this wrong detection, the ego vehicle decided to execute a lane change. Fortunately, this maneuver was possible as the left lane was empty. Otherwise, the ego could suddenly brake, possibly resulting in a rear-end collision with vehicle 4.
This deeper and more fruitful analysis also matches the process proposed by ISO 21448 (SOTIF), to identify limitations, weaknesses and disturbances that could lead to hazards and relevant events under unfavorable triggering conditions.
Therefore, to develop and validate AD/ADAS, we need to efficiently find, analyze and understand any possible near-miss, underperformance or triggering conditions that challenge the AD/ADAS systems. But with the current highly manual techniques, these events are “needles in the haystack”, hardly impossible to find within millions of driven hours.
By providing an overview of the AD/ADAS system performance, engineers can quickly locate all our relevant “needles” within a structured analysis. This enables to answer questions like:
- Which near-misses occurred in the datalog?
- In which Operational Domain (OD) is my system underperforming, and why?
- Is my development evolving towards better performance?
- Should I modify my functionality requirements to fluently and adequately interact with the real world?
- Does my functionality meet the specified requirements?
So, how can we organize driving data and find those important needles? At IVEX we believe that the best approach is to use specific Safety and Key Performance Indicators (SPIs, KPIs), a.k.a “metrics” aggregated over the recorded/simulated driving data to create an optimal overview of the system performance.
Using metrics to organize the driving data
The challenge of aggregating driving data is not trivial due to the unstructured nature of the recorded data and the constantly changing and dynamic traffic environment. Several levels of comprehension are needed to understand a driving scene. We devise three main metric categories to organize your data: sensor & perception metrics, behavior metrics, and comfort metrics.
The first level of metrics refers to the perception sensors and systems, which are an AV’s initial point of contact with the environment. These metrics represent how well the system perceives the surrounding environment and are useful to highlight underperformance at early stages of development. For example, you can measure false positive object detections, lane extraction failures, etc.
The second level of metrics relates to the control and behavior actions taken by the AD/ADAS system. For example, for an Automated Emergency Braking (AEB) system, you would want to check if the braking signal was triggered at the right moment causing the proper deceleration.
The third level of metrics refers to the comfort a possible passenger will experience. For example, for validating an Automated Lane Keeping Assistance System (ALKS), you can measure any oscillating behavior of the vehicle that would create discomfort for the users.
The best starting point for finding the “needles” of the AD/ADAS functionality under test is using the functional requirements of the system under test and the operational design domain. A curated selection will help you gain a concise overview of the functionality of your driving data.
Once you have decided which metrics are of interest according to the AD/ADAS functionality under test, you can efficiently start organizing your data. Our experts at IVEX have already identified an initial list of metrics over the three discussed levels that can support your analysis. Besides the previous examples, these include, for instance, metrics that track the dimensions of the perceived objects, metrics that check if detected bounding boxes of vehicles split or merge, metrics that monitor the front and lateral distances to the other traffic elements, metrics that predict potential collisions or metrics that evaluate the quality of the detected lane markers. IVEX software also allows engineers to include their own customized KPIs via a simple programming API.
Creating the proper overview of your AD/ADAS stack
After we have the recorded driving data organized with the chosen metrics (KPIs and SPIs) to study our AV functionality, how do we find our “needle” situations among all the hours of data?
At IVEX we created an optimized pipeline to process all your driving data recordings efficiently. We aggregate all the measurement results, providing a clear organization based on metrics. Additionally, as current L2+ ADAS systems are ODD restricted (e.g. ALKS is only meant for motorways while running at less than 60km/h), we segment the analysis depending on the ODD, which helps to simplify your searching space.
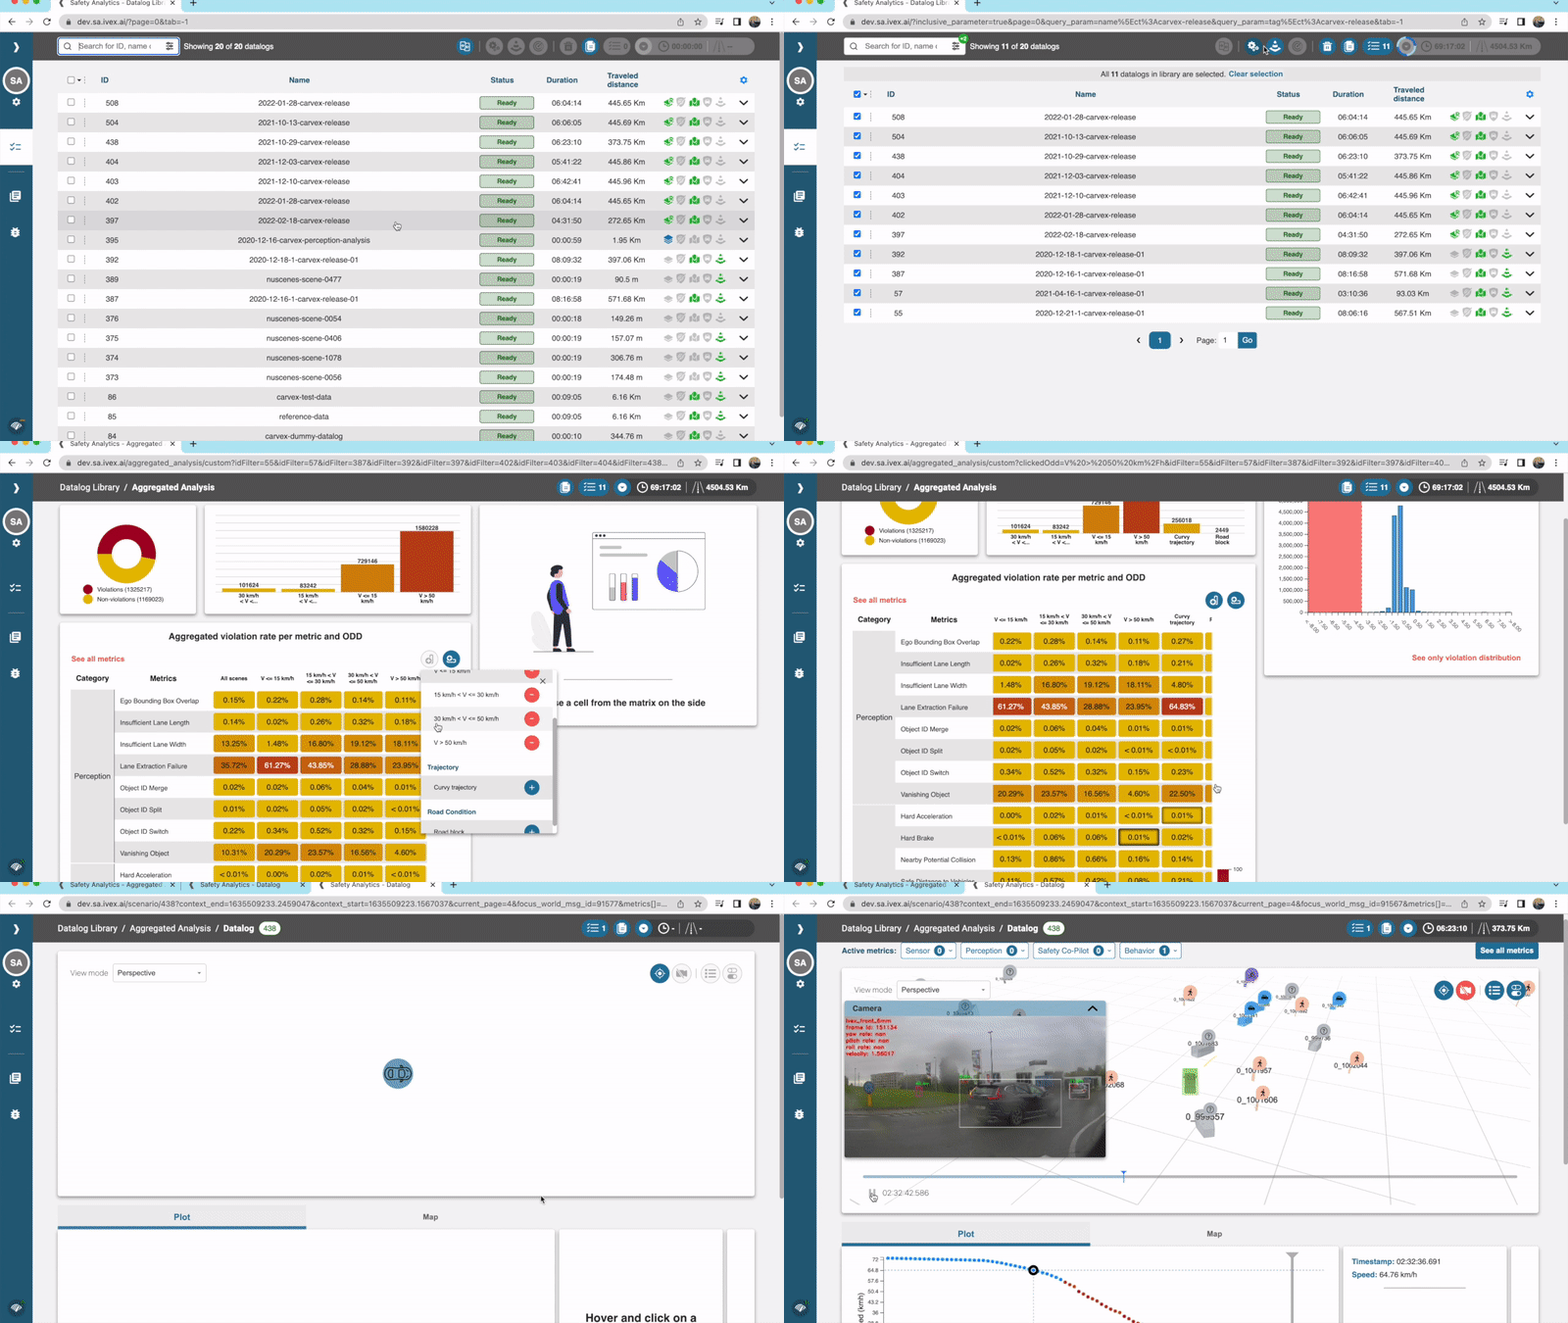
We present all the aggregated results in a simple, customizable interface, allowing you to find the specific situation you need, and inspect in detail the specific driving scene in just three clicks. Engineers would need only three clicks to “find the needle in your haystack” of driving data. It is like using a giant magnet to find your needle. Let’s see it in more detail.

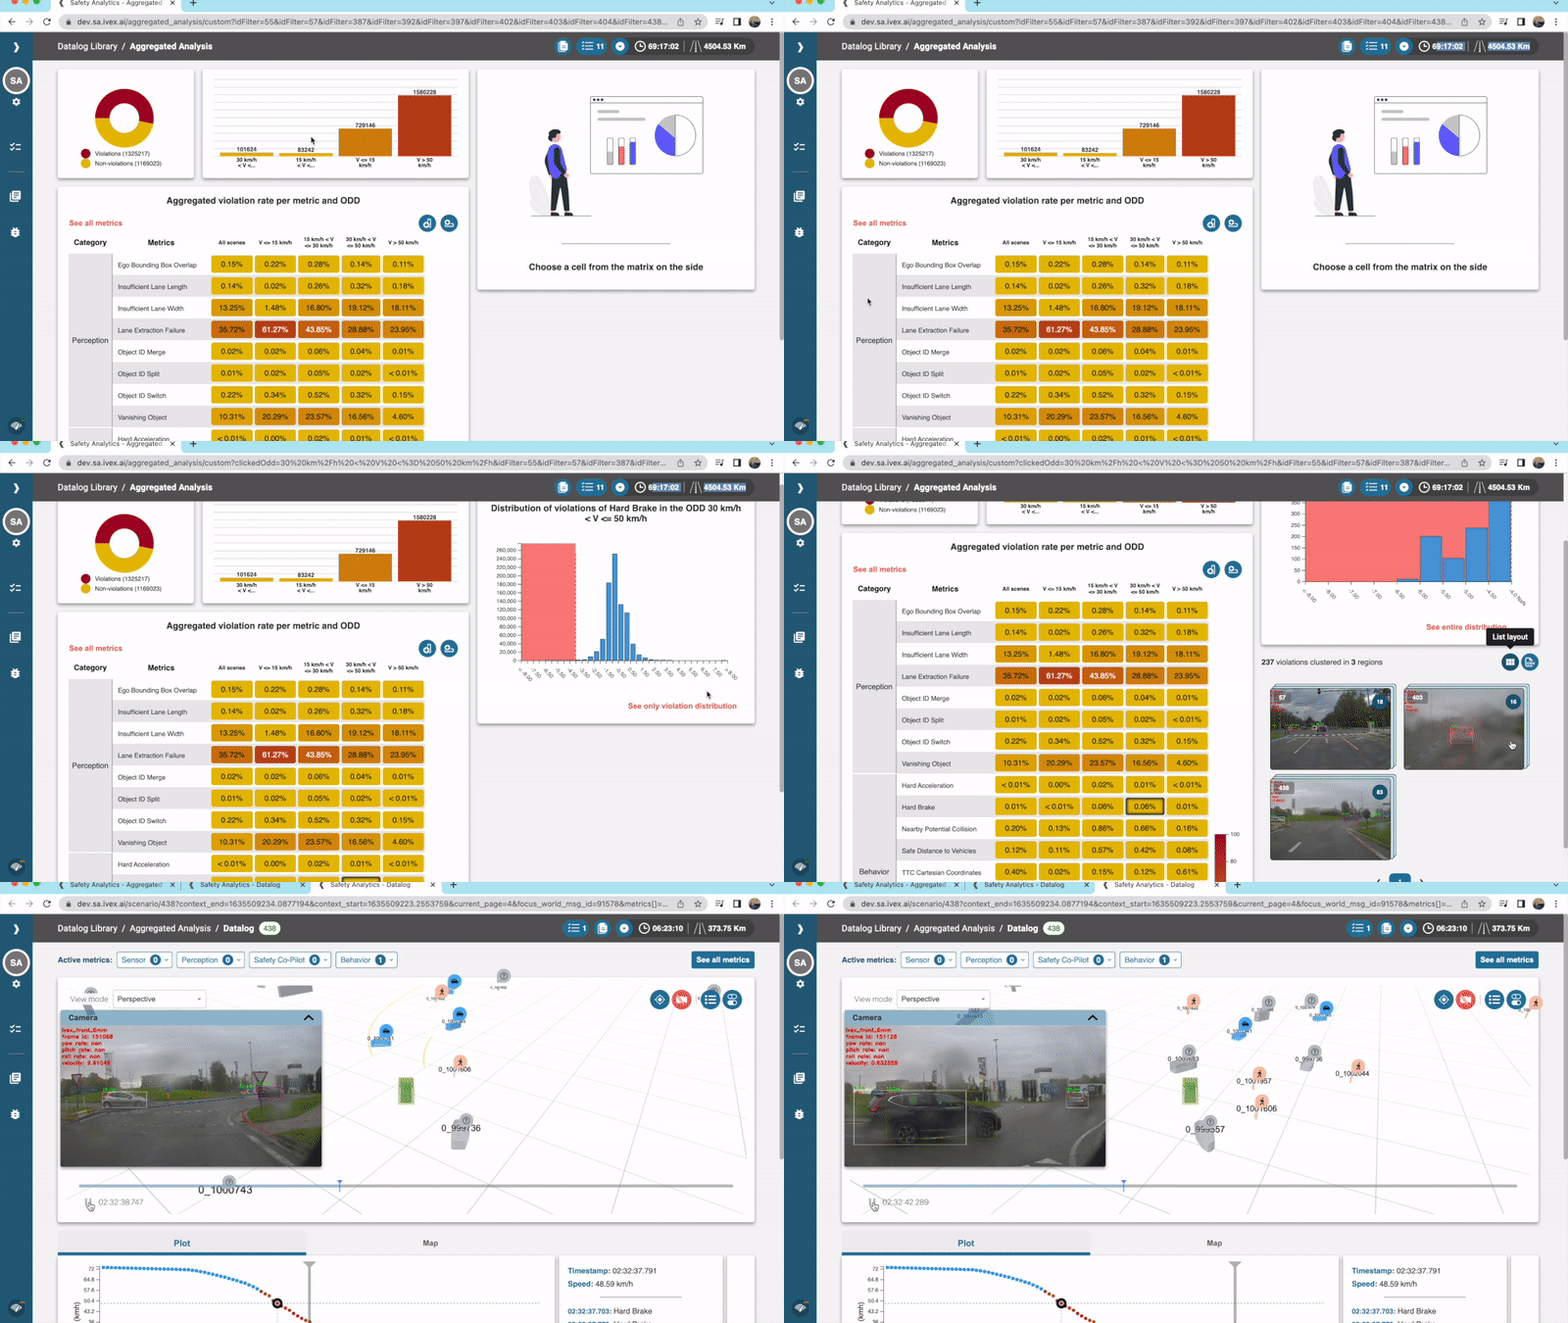
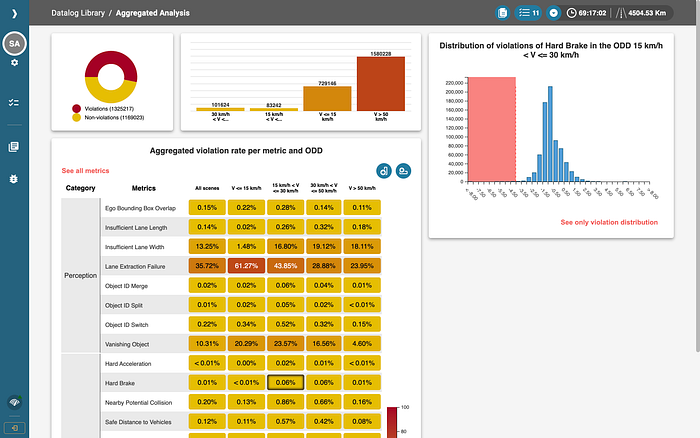
Here we can see the results of the organized data, aggregated over the full set of datalogs and presented in a simple but instructive way. The results of each metric are displayed on each row, whereas the ODDs are present in the columns. In each cell, the software displays the violation rates of the corresponding pair of metric-ODD.
For example, let’s suppose we are analyzing the comfort of our driving system in an urban environment. In one click, we select the “Hard Brake” metric at “Low Speed” ODD (less than 15 Km/h).
Next, we are presented with the distribution of braking decelerations applied along all analyzed datalogs in the selected ODD. If your requirements state, for instance, that the applied braking should be less than 4 m/s2, you can instantaneously see that there were 0.06% situations that did not meet this requirement. With a second click you can select a specific braking range (column in the distribution) to analyze specific events/scenarios.

At this moment you can see that IVEX software has already cleared all the “hay” so what remains are only the “needles”. IVEX software presents the different relevant situations of interest. Engineers can then directly access the specific recorded data at the exact timestamp, observing the full situation and gaining extra insights about the issue.
Let’s recap. From 69hours of driving, we just got to the specific events in the data in which the vehicle faced a hard brake (deceleration greater than 4 m/2), making it highly uncomfortable for the passenger.
You can see a very simple workflow supported by IVEX tools which allows an engineer to find relevant events from a massive amount of data, in just a few seconds. Besides identifying the relevant events, the tool provides reports that can be used as part of the safety argumentation according to SOTIF and UL4600. More concretely the software helps engineers to:
- Identify specific events from massive datalogs
- Identify triggering conditions to be added as part of SOTIF analysis
- Keep track of the evolution of an AD/ADAS system over different iterations to show arguments of system improvement, as well to provide concrete arguments used in UL4600 documentation
I hope we could give you some ideas on how to analyze the data from your AD/ADAS using the IVEX Safety Analytics platform. If you want to learn more about our Safety Analytics platform or IVEX in general, feel free to contact our team.
